







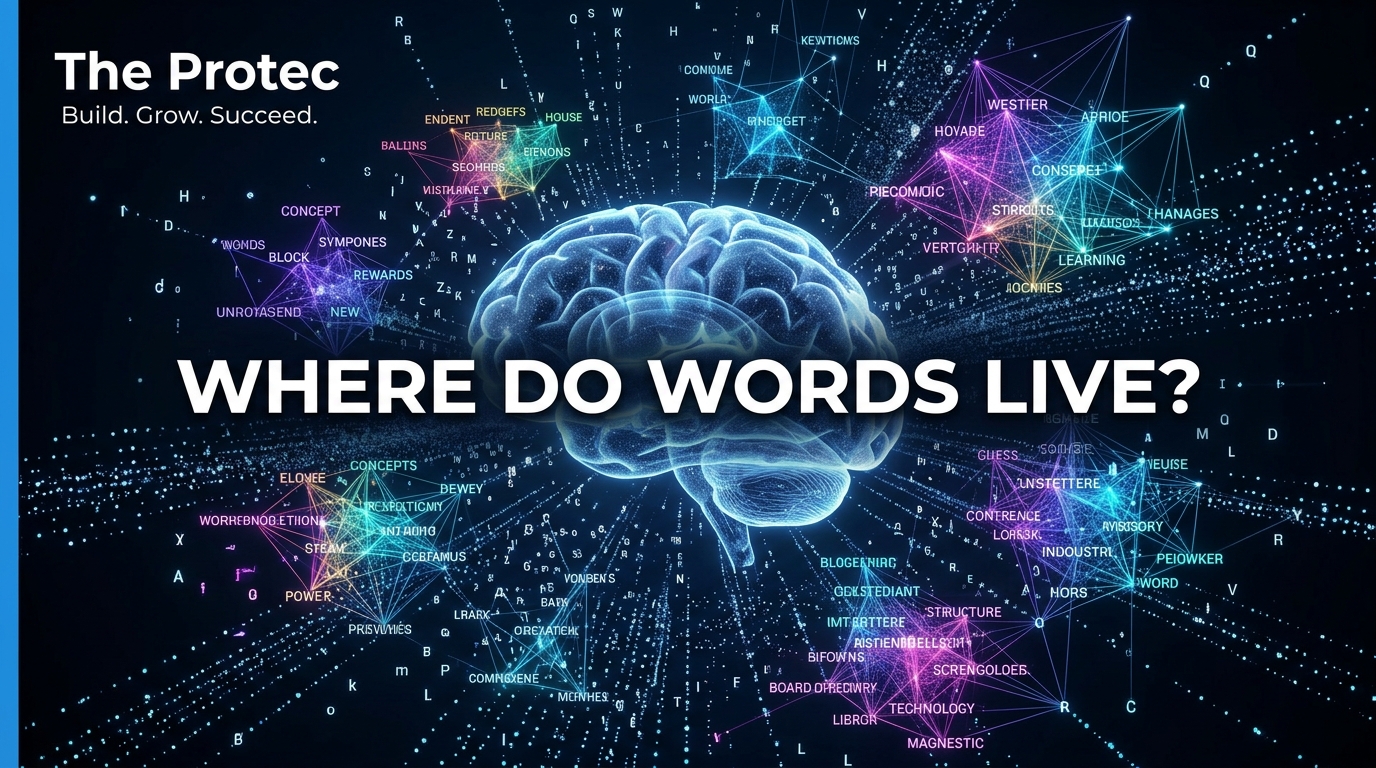
A language model never sees a sentence as ink, sound or a row of dictionary definitions. To understand how AI models represent language, we have to look at the numerical states created as text passes through the network. A visualization experiment using Qwen3-1.7B offers an unusually accessible view: thousands of synthetic examples in English, Chinese, German, Croatian and Python code become clouds, bands and near-planar structures inside a mathematical representation space.
These images are intriguing, but they are not photographs of thoughts. They are low-dimensional projections of high-dimensional activation vectors. They can reveal statistical structure—such as overlap among languages or separation between prose and code—without proving that a model understands language like a person, maintains separate language-specific minds or possesses consciousness.
What the Qwen language model experiment examined
The experiment documented in the Qwen conversation state-space field notes generated thousands of synthetic samples across four natural languages and Python. It then collected internal token states from Qwen3-1.7B and projected those states into three dimensions with principal component analysis, or PCA. A related Hacker News discussion explored possible interpretations and methodological questions.
The distinction between synthetic samples and actual conversations matters. These were generated examples designed for an experiment, not a representative archive of private, real-world user chats. Their topics, lengths, phrasing and language distribution reflect the sampling procedure and prompts. Accordingly, the visual patterns describe this dataset interacting with this model—not all human communication or every multilingual model.
The useful early answer is that language and code produced overlapping yet distinguishable patterns. That is consistent with a model sharing some computational structure across inputs while preserving information about syntax, script, vocabulary and format. The plots do not establish exactly what each direction encodes, however. That requires additional tests.
From words to LLM embeddings and token vectors
Transformers cannot directly process words as people perceive them. First, a tokenizer divides text into units called tokens. A token may be a complete word, part of a word, punctuation, a Chinese character or a fragment of source code. The sentence “Models learn patterns” might become several token IDs, while an identifier such as calculate_total could be split into multiple pieces.
Each ID is initially mapped to an embedding: a list of numbers locating that token in a high-dimensional space. Imagine describing a city using coordinates for latitude, longitude, elevation, population and thousands of other attributes. An embedding is conceptually similar, except its coordinates are learned during training rather than assigned human-readable labels.
An embedding is only the starting point. As a token passes through transformer layers, self-attention incorporates information from other tokens, while feed-forward components apply learned transformations. The resulting contextual token vector for “bank” can therefore differ between “river bank” and “bank account,” even though both began from the same token embedding.
The transformer residual stream
The transformer residual stream is a useful way to understand this evolution. Each layer reads the current vector state and adds updates produced by attention and feed-forward computations. In simplified form, a layer behaves roughly like:
next state = current state + attention update + feed-forward update
The actual architecture contains normalization and other implementation details, but the additive picture captures the main idea. The residual stream acts like a shared workspace carrying information from early layers to later ones. A recorded point in the experiment represents a token’s state at a chosen location in that process—not a self-contained belief, sentence or memory.
This also explains why the term AI internal representations is plural. A token has an initial embedding and many subsequent contextual states. Which layer, token position and processing stage researchers capture can substantially change the geometry they observe.
Qwen3-1.7B token vectors contain far more than three coordinates, so they cannot be plotted directly on a normal screen. Dimensionality reduction creates a smaller view that preserves selected properties of the original data. PCA is one of the most established methods for doing this.
Suppose a collection of photographs is described by hundreds of measurements. If brightness varies most, the first principal component may follow brightness. If color temperature is the next largest independent source of variation, that may become the second component. PCA performs an analogous calculation without assigning such friendly names: it finds orthogonal directions that capture as much variance as possible, in descending order.
- The token-state vectors are assembled into a data matrix and centered.
- PCA finds the direction containing the greatest variation.
- It finds additional perpendicular directions capturing progressively less variation.
- Researchers plot the first two or three coordinates and color points by language, category or another label.
A PCA visualization is therefore a view from selected mathematical angles. Points that overlap in three dimensions may remain separated in dimensions omitted from the chart. Conversely, a visible gap can be amplified by the chosen dataset, scale or projection. PCA is excellent for exploration, but it does not automatically explain the cause of a cluster.
Understanding the reported 99.3% plane—and the 17.6% caveat
The experiment’s most eye-catching observation was that approximately 99.3% of the English token-state variation appeared to fit within a plane in one three-dimensional projection. Visually, that can resemble a sheet rather than a shapeless cloud. It suggests that within the displayed three-dimensional coordinates, the English points had a strikingly low-dimensional geometry.
The crucial qualification is that the first three principal components captured only 17.6% of the variation in the full token-state data. The remaining 82.4% lay in dimensions not shown. The 99.3% figure must therefore not be read as “nearly all English language processing happens in two dimensions.” It describes structure within a limited projection, while the 17.6% figure measures how much of the original high-dimensional variance that projection retained.
Think of a complex sculpture photographed from one angle. Its shadow may look almost perfectly flat, but that does not mean the sculpture itself has no depth. Likewise, a plane in PCA space can be a meaningful geometric feature without being a complete account of the model’s internal computation.
Reading the multilingual and code patterns
The author’s plots show different languages and Python forming patterns that overlap in some regions while remaining distinguishable in others. Several mechanisms could contribute:
- Writing system and tokenization: Chinese characters produce token sequences unlike Latin-alphabet text. German compounds and Croatian morphology can also lead to different token patterns.
- Grammar and word order: Languages distribute syntactic cues differently, which can alter contextual states.
- Training distribution: The amount, quality and subject matter of training data vary across languages.
- Code structure: Python contains indentation, operators, identifiers and repetitive syntax that differ from ordinary prose.
- Prompt design: Similar templates can create shared patterns, while language-specific topics can exaggerate separation.
Overlap is especially interesting because it is compatible with a shared AI representation space. A multilingual model must often reuse parameters for related functions: tracking references, predicting likely continuations, recognizing sentiment or handling question-and-answer formats. Similar meanings in different languages may consequently recruit partially shared directions or circuits.
But a colorful cluster is not a concept detector. To test whether a direction represents meaning across languages, researchers could compare carefully matched translations, train probes on one language and test them on another, intervene on selected activations, or use activation patching to determine whether a feature causally affects output. Modern interpretability work increasingly combines visualizations with these behavioral and causal techniques because geometry alone is ambiguous.
The cautious answer is: often to some degree, but not in a single, simple universal map. Research on multilingual AI models has repeatedly found evidence of transferable features, while also finding language-, script- and task-specific information. Both can coexist in the same token vector.
Imagine an international railway station. Travelers speaking different languages share platforms, tracks and destinations, yet signs, ticket formats and local procedures remain distinct. In a similar way, a model may encode broad semantic or functional regularities alongside clues identifying language and surface form. Overlapping clouds are compatible with this arrangement, but they do not reveal which individual coordinates carry which information.
Nor does shared geometry imply human-like understanding. A model may organize statistically related contexts in ways that support translation and prediction without possessing lived experience, intentions or awareness. Terms such as “hidden mind” are useful hooks only if readers remember that the evidence concerns numerical computation.
Limitations that shape the interpretation
- Model size: Qwen3-1.7B is one model at one scale. Larger models, different architectures or differently trained systems may produce other geometries.
- Synthetic sampling: Generated examples can inherit recurring templates and model-produced phrasing. Real conversations are noisier and more diverse.
- Prompt and topic effects: If languages receive different subjects, lengths or instructions, apparent language clusters may partly encode those differences.
- Token weighting: Frequent punctuation, whitespace and common tokens can dominate a plot unless sampling and aggregation are handled carefully.
- Layer selection: Early, middle and late residual-stream states perform different roles. A pattern at one layer may disappear or transform elsewhere.
- Projection choice: PCA preserves variance, not meaning, neighborhoods or causal importance. Other methods may produce visually different maps.
- Interpretive uncertainty: A direction can mix multiple features, and correlation between a cluster and a label does not identify the computation responsible.
Reproducible follow-up work would vary prompts, balance token counts, compare layers, include matched translations, test multiple random samples and contrast PCA with other projection methods. Most importantly, it would pair pictures with quantitative and causal evaluations.
What these visualizations genuinely teach us
The experiment provides a compelling visual introduction to how large language models work: text becomes tokens, tokens become vectors, and those vectors evolve through a residual stream whose geometry can be sampled and projected. Language and code leave detectable signatures, yet some structures overlap, suggesting shared computation rather than isolated miniature minds.
The right conclusion is neither that the plots expose consciousness nor that they are meaningless decoration. They are partial measurements of AI language processing—valuable for forming hypotheses, provided their missing dimensions and experimental assumptions remain visible too.
Frequently asked questions
Are LLM embeddings the same as token states?
No. An embedding is the token’s initial learned vector. A token state is a contextual representation produced as that vector is updated through transformer layers.
Does a language cluster mean the model has a separate mind for that language?
No. Clustering shows that language identity or correlated features are detectable in the sampled activations. Shared model parameters can produce both distinct and overlapping patterns without separate minds.
Why can three PCA components be misleading?
They display only the variance captured by three directions. In this experiment, those directions represented 17.6% of full token-state variation, leaving most variation outside the visualization.
Does the 99.3% plane prove English is represented in two dimensions?
No. It describes an approximately planar pattern within one three-dimensional projection. It does not show that the model’s complete English representation is two-dimensional.