








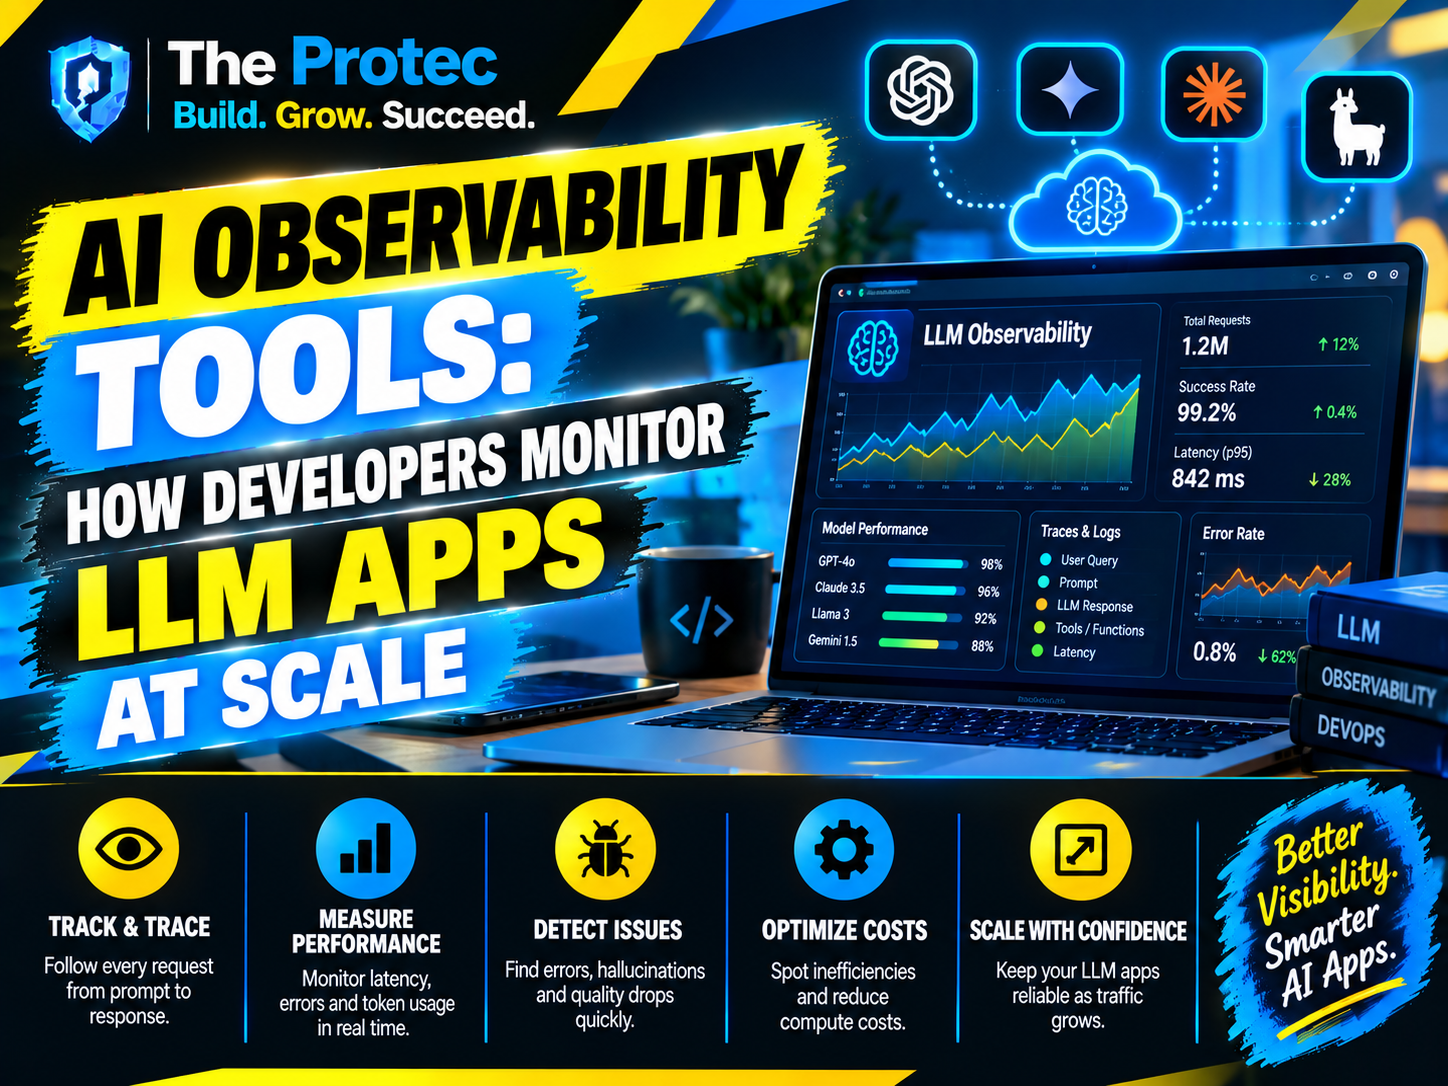
An LLM application can perform flawlessly in a test environment and still fail unpredictably after deployment. A model may hallucinate on a rare document, ignore part of a system prompt, call the wrong tool, or consume far more tokens than expected. Traditional dashboards can show that an API request was slow or unsuccessful, but they rarely explain why an AI-generated response was inaccurate, expensive, or unsafe.
That gap has created a fast-growing category of AI observability tools. These platforms help developers inspect the full path from user input to model output, including retrieved context, prompt versions, tool calls, evaluation scores, latency, and cost. Effective LLM monitoring turns opaque model behavior into structured production data that engineering teams can investigate and improve.
What Is LLM Observability?
LLM observability is the practice of collecting and analyzing signals that explain how a generative AI application behaves in production. It extends conventional application observability beyond logs, metrics, and infrastructure traces. Instead of stopping at CPU usage or HTTP status codes, it captures model-specific information such as prompts, completions, token counts, retrieval results, tool decisions, guardrail events, and quality scores.
Monitoring and observability are related but not identical. Monitoring alerts a team when a known metric crosses a threshold, such as a spike in model latency. Observability provides enough context to investigate unfamiliar problems, such as why latency increased only for requests using a particular prompt, knowledge base, or agent tool.
Evaluation is another connected discipline. Evaluations measure output quality against defined criteria, while observability connects those scores to real requests, model configurations, and user outcomes. Modern AI observability tools combine all three capabilities because an LLM response can return successfully at the API level while still being factually wrong.
Core Signals Captured by AI Observability Tools
A useful observability system does more than store prompt and response text. It reconstructs the application workflow and attaches operational, quality, and business metadata to each step.
Prompt Tracing and Request Lineage
Prompt tracing records the sequence of events behind an LLM response. A trace may begin with a user message, continue through query rewriting and vector retrieval, and then include a model call, tool execution, validation step, and final response. Each operation appears as a span with timing, inputs, outputs, errors, and relevant configuration.
This lineage is essential for applications built with retrieval-augmented generation or autonomous agents. If an answer is wrong, developers can determine whether the retriever returned weak documents, the prompt omitted required instructions, a tool supplied stale data, or the model misinterpreted accurate context. Prompt versions should also be recorded so regressions can be connected to specific releases rather than investigated from memory.
Because traces may contain private conversations or proprietary documents, mature platforms support field-level redaction, sampling, access controls, retention policies, and regional storage. Capturing every raw prompt without a privacy strategy can create more risk than insight.
Hallucination and Groundedness Detection
Hallucination detection attempts to identify statements that are unsupported, fabricated, or inconsistent with available evidence. There is no universal detector that can label every response correctly. Production systems typically combine several techniques: checking claims against retrieved passages, using a separate model as a judge, applying deterministic business rules, validating citations, and collecting user feedback.
For RAG applications, groundedness and answer relevance are especially useful metrics. Groundedness asks whether the response is supported by the supplied context. Relevance asks whether it actually addresses the user’s question. A response can be grounded but irrelevant, or helpful while containing an unsupported claim. Tracking these dimensions separately produces more actionable results than a single quality score.
High-risk workflows may add human review for low-confidence or policy-sensitive outputs. Observability data helps prioritize that review by surfacing requests with missing citations, contradictory evidence, unusual tool behavior, or poor evaluator scores.
Token-Cost and Latency Monitoring
Token usage directly affects the unit economics of an LLM product. AI observability tools record input, output, cached, reasoning, audio, and image usage where applicable, then map those units to the pricing of the model and provider. Teams can analyze cost per request, customer, feature, workflow, or successful task instead of relying only on an aggregate monthly invoice.
Cost traces often reveal hidden inefficiencies: oversized system prompts, redundant retrieved passages, unbounded conversation histories, retry loops, or expensive models handling simple classification tasks. Developers can then introduce prompt compression, caching, model routing, context limits, or smaller specialized models.
Latency should be separated into retrieval time, queue time, model time, tool execution, and post-processing. Time to first token and total completion time are both important for streaming experiences. Averages alone can hide severe tail latency, so teams should monitor percentile distributions and compare them across model and prompt versions.
Continuous LLM Evaluation
Offline evaluations test candidate changes against curated datasets before release. Online evaluations score a sample of real production traffic after deployment. Strong LLM observability connects both approaches, allowing developers to compare models or prompts using the same criteria.
Evaluation methods include exact matching, schema validation, semantic similarity, retrieval precision, citation correctness, safety checks, model-based judges, and human ratings. The right method depends on the task. A customer support assistant may be graded for resolution quality and policy compliance, while a code-generation tool may run generated code in an isolated test environment.
Model-based judges are flexible, but they can introduce bias and inconsistency. Teams should calibrate them against human-reviewed examples, use explicit scoring rubrics, and periodically test whether evaluator behavior has drifted. Evaluation scores are most valuable when linked to deployment versions and business outcomes such as acceptance, escalation, or task completion.
Production Debugging for Agents and Tool Calls
Agentic applications are harder to debug because one request can trigger planning, memory lookup, multiple model calls, external tools, and retries. LLM monitoring should preserve the parent-child relationship among those steps. Developers need to see which tool was selected, the arguments supplied, the result returned, and how that result influenced the next decision.
Common production failures include malformed tool arguments, repeated actions, exhausted step limits, permission errors, and successful calls to the wrong resource. Trace views make these failures reproducible. A developer can filter by agent version, tool name, tenant, model, or error type and then inspect the exact execution path rather than searching disconnected logs.
How an LLM Observability Pipeline Works
Instrumentation usually begins inside the application or AI gateway. SDKs and framework integrations create traces around model calls, retrieval operations, tools, and evaluators. The application enriches those traces with metadata such as user tier, feature name, deployment environment, experiment group, and prompt version.
- Collection captures traces, token usage, model settings, errors, feedback, and evaluation results.
- Processing redacts sensitive fields, normalizes provider-specific data, calculates costs, and applies sampling rules.
- Storage indexes traces and metrics so teams can investigate individual requests or aggregate trends.
- Analysis powers dashboards, experiments, anomaly detection, quality scoring, and root-cause investigation.
- Alerting notifies teams when cost, latency, error, safety, or quality thresholds are breached.
Open instrumentation is increasingly important for teams using several model providers. The industry is aligning around distributed tracing patterns and emerging generative AI conventions within OpenTelemetry. Standardized telemetry reduces vendor lock-in and lets AI traces correlate with databases, queues, APIs, and infrastructure.
Choosing Between AI Observability Tools
The best tool depends on application complexity, compliance obligations, traffic volume, and the team’s existing observability stack. Some organizations prefer a dedicated LLM observability platform with prompt management and built-in evaluators. Others extend a general application performance platform or deploy an open-source tracing system in their own environment.
Before selecting a platform, evaluate whether it provides:
- End-to-end tracing across models, retrieval, agents, and tools
- Provider-neutral token accounting and configurable cost calculations
- Offline experiments and online production evaluations
- Prompt, model, dataset, and deployment version tracking
- Redaction, encryption, role-based access, and retention controls
- Custom dashboards, alerts, APIs, and telemetry export
- Useful integrations without forcing every request through a proprietary proxy
A polished trace interface is helpful, but data portability matters just as much. Teams should confirm that they can export telemetry, define custom evaluators, and preserve trace continuity when models or orchestration frameworks change.
Best Practices for Reliable LLM Monitoring
Start with a small set of service-level objectives tied to the user experience. Examples include maximum cost per resolved request, minimum groundedness for answers with citations, acceptable tool success rates, and target latency at the 95th percentile. Collecting hundreds of metrics without ownership or thresholds creates dashboards that no one uses.
Separate debugging data from analytics data. Engineers may need detailed traces for a sampled subset of requests, while product teams need aggregate quality and adoption trends across all traffic. Adaptive sampling can retain failures, high-cost requests, unusual agent paths, and low evaluation scores while reducing storage volume for routine interactions.
Build a production failure dataset from real incidents. When a harmful, inaccurate, or frustrating response appears, remove sensitive information and add the case to a regression suite. This creates a feedback loop in which observability improves evaluation coverage, and evaluation prevents known failures from returning.
Finally, treat security as part of quality. Monitor prompt injection attempts, unauthorized tool access, sensitive-data leakage, and unsafe output alongside latency and accuracy. The OWASP GenAI Security Project provides useful guidance for understanding risks in LLM and agentic systems.
Where LLM Observability Is Heading
By September 2026, LLM observability is moving beyond simple prompt logging. Multimodal applications require traces that connect text, images, audio, and video. Agent systems need visibility into long-running tasks, delegated subagents, memory, permissions, and external protocols. At the same time, organizations increasingly want evaluation results expressed in business terms, not only technical scores.
The next generation of tools will automate more diagnosis while keeping evidence visible. Instead of merely reporting that quality declined, an observability platform may identify the affected prompt version, retrieval source, model region, or tool schema. Human judgment will remain essential, but developers will spend less time reconstructing what happened.
Frequently Asked Questions
What is the difference between LLM monitoring and LLM observability?
LLM monitoring tracks known production metrics and sends alerts when defined limits are exceeded. LLM observability captures detailed context, traces, and evaluations that help developers investigate both expected and unfamiliar failures. Monitoring identifies a symptom; observability supports root-cause analysis.
Can AI observability tools detect every hallucination?
No. Hallucination detection is probabilistic and task-dependent. The strongest systems combine evidence-based checks, deterministic validation, calibrated model judges, user feedback, and human review. High-stakes applications should never depend on one automated hallucination score.
Should production prompts and responses always be stored?
Not necessarily. Raw content may contain personal, regulated, or proprietary information. Teams can redact sensitive fields, hash identifiers, store structured metadata, shorten retention, or sample requests. Collection policies should reflect the application’s debugging needs and legal obligations.
Which metrics should an LLM application track first?
Begin with task success, error rate, end-to-end latency, time to first token, token cost, user feedback, and one or two task-specific quality measures. RAG systems should also track retrieval relevance and groundedness, while agents should monitor tool failures, retries, step counts, and completion rates.
Conclusion
Production LLM applications cannot be managed as ordinary API integrations. Their failures often involve meaning, evidence, cost, and multi-step decisions rather than simple status codes. AI observability tools give developers the traces and measurements needed to understand those failures.
By combining prompt tracing, hallucination detection, token-cost monitoring, continuous evaluation, and agent debugging, teams can turn unpredictable model behavior into an engineering discipline. The result is not only a more reliable LLM application, but also a safer and more economically sustainable product.